A Sound Source Separation System for Percussion Instruments
This project is proposed and researched by
Masataka Goto.
Japanese version is
here.

 Introduction:
We have developed a sound source separation system that
extracts information such as the kind of instrument, onset time,
and loudness of each note from an acoustic signal that consists
of sounds of several kinds of percussion instruments.
We proposed a new technique of sound source separation for
percussion instruments. The technique, an improved version of
template matching, enables the system to recognize each sound of
percussion instruments even if the input is the mixture of
several sounds or if the loudness varies. Experimental results
show that this system can extract all notes from the sounds of
some 8 beat drum patterns.
The system can detect the onset times of each drum sound in a
popular-music drum performance, which is a polyphonic sound mixture of
nine kinds of drum instruments: the bass drum (BD), snare drum (SD),
low tom (LT), middle tom (MT), high tom (HT), hihat close (HC), hihat
open (HO), ride cymbal (RI), and crash cymbal (CR). As far as we
know, this system developed in 1992 and 1993 was the earliest work
that can deal with such polyphonic drum-sound mixture, while the
system cannot deal with a sound mixture of both drums and other
musical instruments. The system is based on a template-matching
method that is extended to identify a template pattern in a sound
mixture by introducing a new distance measure. This measure can
compute an appropriate distance between a pattern in the input power
spectrum and the corresponding template pattern even though the input
is a mixture of several template patterns. Each template pattern
corresponds to a different drum sound: we prepared nine template
patterns for the nine kinds of drum instruments.
Experimental Results:
The following figures are excerpts of our experimental results
described in the reference [1]
(published in a Japanese journal named
``The Transactions of
the Institute of Electronics,
Information and Communication Engineers D-II'').
By clicking a figure, you can see the large (original) version.
Figure 1: (Experiment 1) An original score.
The input audio signal generated by a MIDI sound module
is a performance of this score represented by a standard MIDI file (SMF). The tempo is 120 M.M.
Figure 2: (Experiment 1) The correct answer (the ground truth). This
corresponds to the above original score: this is yet another
representation of the score.
Figure 3: (Experiment 1) The output of our system. Each row
corresponds to a different drum instrument and triangle marks on each
row shows its onset times detected by the system. The horizontal
width of a triangle mark indicates the amplitude. A small vertical
line segment in the row of the hihat open (HO) indicates the offset
time, the time when it stops sounding.
Figure 4: (Experiment 2) An original score.
The input audio signal generated by a MIDI sound module
is a performance of this score represented by a standard MIDI file (SMF). The tempo is 120 M.M.
Figure 5: (Experiment 2) The correct answer (the ground truth). This
corresponds to the above original score: this is yet another
representation of the score.
Figure 6: (Experiment 2) The output of our system. Each row
corresponds to a different drum instrument and triangle marks on each
row shows its onset times detected by the system. The horizontal
width of a triangle mark indicates the amplitude. A small vertical
line segment in the row of the hihat open (HO) indicates the offset
time, the time when it stops sounding.
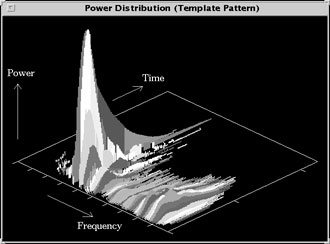
Figure 7: A template pattern of a snare-drum (SD) sound. Each
template pattern is represented as the power distribution that
consists of frequency components of its sound. Those frequency
components are extracted from the FFT-based power spectrum.
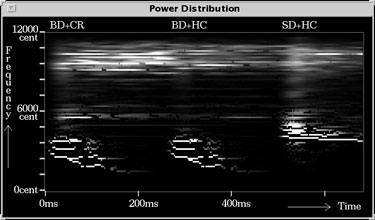
Figure 8: An example of the power distribution of the input sound
mixture. Our method finds a template pattern in this distribution
even if a pattern is overlapped with other patterns and the amplitude
of a pattern is different from the original template pattern. This
representation of the power distribution with the log-scale frequency
axis in cents ([cent]) is used for detecting the bass drum (BD), snare
drum (SD), low tom (LT), middle tom (MT), and high tom (HT). In our
formulation, there are 100 cents to a tempered semitone and 1200 to an
octave.
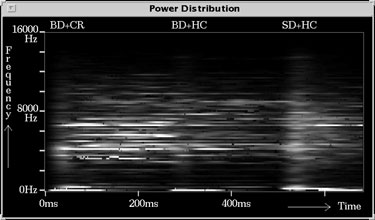
Figure 9: Another representation of the power distribution that is
same with Figure 8. This representation of the power distribution
with the linear frequency axis in hertz ([Hz]) is used for detecting
the hihat close (HC), hihat open (HO), ride cymbal (RI), and crash
cymbal (CR).
References:
- Masataka Goto and Yoichi Muraoka:
A Sound Source Separation System for Percussion Instruments,
The Transactions of the Institute of Electronics,
Information and Communication Engineers D-II,
Vol.J77-D-II, No.5, pp.901-911, May 1994 (in Japanese).
- Masataka Goto, Masahiro Tabuchi and Yoichi Muraoka:
An Automatic Transcription System for Percussion Instruments,
Proceedings of the 46th Annual Convention IPS Japan,
7Q-2, March 1993 (in Japanese).
Back to:
Masataka GOTO
<m.goto [at] aist.go.jp>
All pages are copyrighted by the author.
Unauthorized reproduction is strictly prohibited.
last update: October 22, 1996