Research>Enabling Environment

Supporting Evidence-Based Nursing with a Minimally Privacy-Violative Activity Observation System for the Aged

>> Japanese

Outline
We are currently developing an ultrasonic system for tracking people and objects as a way of observing activity in living spaces while keeping invasion of privacy to a minimum. Our aim is to create a system that improves quality of life (QOL). By tracking people and objects, our system would allow the observation of activities of daily living (ADL). Data from these observations could then be used to construct behavior models, which could in turn facilitate the provision of evidence-based care. We are currently investigating one possible application by conducting research on a system for use in aged care as a social welfare.
Ultrasonic Observation System

Our ultrasonic observation system uses ultrasonic sensors (see figures 1 and 2) embedded in the environment to 1) track the location of people’s heads using a radar method, and 2) track the location of objects using a tag method. Because ultrasound is used to make the measurements, the only information collected from the subject is distance information used for calculating location and information about three-dimensional position that can be derived from that distance information. It can be said that this design gives the system a 3rd function, that of minimizing invasion of privacy at the sensor level.


Figure 1:Ultrasonic Sensor System Figure 2:System Configuration

Ultrasonic Tag Function

This function uses small ultrasound transmitters (65 × 44 × 20, two-week battery) called tags (see figure 3). These tags emit ultrasound signals which are received by a group of ultrasound receivers that are embedded in the environment (in walls and ceilings). The system then uses these signals to calculate the three-dimensional locations of the tags. Average error = 30 mm. Resolution = 5 mm.


Figure 3:Ultrasonic Tag

Ultrasonic Radar Function

This function uses a group of ultrasound transmitters and a group of ultrasound receivers, both of which are embedded in the ceiling. Ultrasound signals emitted from the ultrasound transmitters are reflected off the subject (a person’s head) before being received by the group of ultrasound receivers. The system then uses these signals to calculate the three-dimensional location of the subject (see figure 4). Average error = 54 mm. Resolution = 145 mm.

Figure 4:Tracking Position of Human Head

Experimental Results

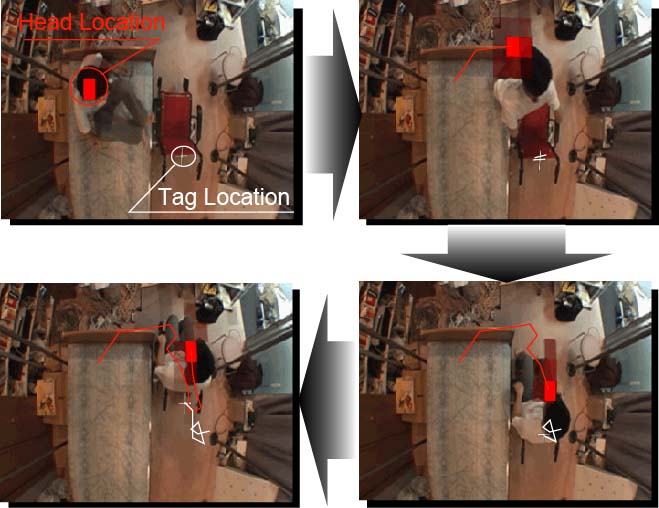
Figure 5 shows the results of an experiment in which the radar and tag functions were used to simultaneously track a person and an object. The tag was attached to a wheelchair and used to track its location. The red markings in the photographs show the location and path of the person as determined by the radar function, while the white markings show the location and path of the object (wheelchair) as determined by the tag function.


Figure 5:Experiment by Ultrasonic Sensor System

Application in Nursing Homes: Proposal for an Evidence-Based Nursing Support System that Utilizes Behavior Pattern Awareness
We installed this system in a nursing home in Akishima City, Tokyo, and monitored the behavior of a patient over a period of 46 days. Figure 6 shows the floor plan of observation space used in the nursing home. The path in the diagram is one of the paths made by movement of the subject’s wheelchair.
Information about location was used to monitor behavior, and behavior analysis was performed. One such example is shown in figure 7. The horizontal axis represents the passage of time over one day (0 o’clock to 23 o’clock). The red bar graph shows the number of times the subject left the bed area over the 46 days, and the blue bar graph shows the number of times the patient left the bed area and entered the toilet . The numbers show the probability of going to the toilet. From the graph we can see that when the subject leaves the bed area at around 6 o’clock, the probability that he will enter the toilet is approximately 30 percent. In contrast, when the subject leaves the bed area at around 8 o’clock, the probability that he/she will enter the toilet is approximately 90 percent. From these observations we can predict that this patient is more likely to require assistance going to the toilet (assistance in getting to the toilet and moving from wheelchair to toilet seat) when he leaves the bed area around 8 o’clock than when he/she leaves the bed area around 6 o’clock. This information could be used to facilitate nursing by giving caregivers a better idea of when the patient might need assistance going to the toilet.

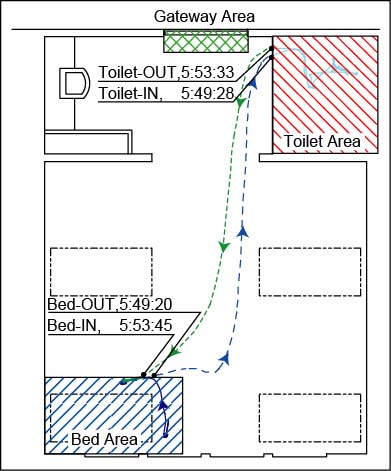
Figure 6:Tag Trajectory.


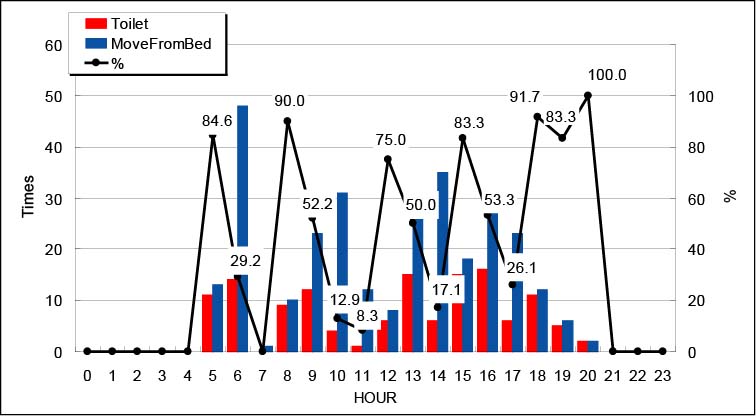
Figure 7: Number of trips to the toilet and the number of times the patient got out of bed over 24 hours, as well as the circumstantial probability that the patient will go to the toilet when they get out of bed

References